1. Why is a Precise OTDR Testing Procedure Critical for Telecom OPEX?
At G-Link, we understand that in modern high-speed FTTx and 5G backhaul deployments, a single measurement error can translate to thousands of dollars in wasted troubleshooting hours. Many network field engineers frequently ask: What is an OTDR used for? While it serves as the ultimate diagnostic tool for checking fiber integrity, failing to follow a standardized otdr fiber testing procedure leads to ghost reflections, inaccurate dB readings, and misdiagnosed cable breaks.
With over 20 years of telecom-grade optical manufacturing experience, we have refined this ultimate guide to help your team achieve laboratory-level precision in the field.
How to perform an OTDR test procedure correctly: 1. Clean Connectors: Inspect and clean all bulkheads and patch cords using professional fiber wipes. 2. Deploy Launch Fiber: Connect an unconditional launch cable (>500m) to eliminate the initial dead zone. 3. Configure Parameters: Set the optimal otdr testing parameters (Wavelength, Distance Range, and Pulse Width) relative to the link length. 4. Run the Trace: Execute an “Average Test” (typically 30–60s) to reduce background Rayleigh noise. 5. Analyze Data: Read the dB/km attenuation slope, splice losses, and reflectance spikes on the trace or via an automatic Event Map.
2. How Do We Prepare Tools and Ensure Safety Before Fiber Testing?
Before pushing the laser activation button, field crews must adhere to the 3C’s of Fiber Optic Health Monitoring:
Cleaning (The #1 Rule): Over 85% of fiber optic network failures originate from contaminated connectors. Dirty end-faces reflect laser power back into the cavity, potentially damaging your OTDR machine and bloating your connector loss readings past 1.0 dB.
Connection (Dead Zone Mitigation): Always deploy an external OTDR Launch Cable (also known as a pulse suppressor). This ensures that the initial connection’s reflection settles down, allowing you to accurately measure the insertion loss of the very first bulkhead.
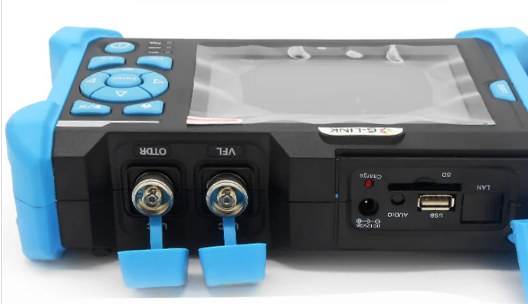
- Certification: Never test with uncalibrated gear. High-precision instruments like the
G-Link TR600 Seriescome with ISO-certified factory calibration certificates to guarantee compliance with ITU-T G.652/G.657 standards.
3. What are the Correct OTDR Testing Parameters for Accurate Traces?
Configuring your otdr testing parameters incorrectly will output misleading traces. To secure precise metrics, your technicians must fine-tune four foundational variables:
Wavelength (nm) Selectivity: * 1310 nm: Excellent for capturing localized events like fusion splices and micro-bends.
1550 nm: Highly sensitive to macro-bends and fiber stress, crucial for long-haul attenuation calculations.
1625 nm / 1650 nm (Filtered): Reserved for live fiber testing. If you are troubleshooting an active PON network in Southeast Asia without disrupting broadband subscribers, instruments like the
G-Link TRP800 PON Seriesutilize a built-in filter at 1625nm to bypass existing downstream traffic.
Distance Range: Set the instrument’s measurement distance to 1.5x to 2x the actual physical length of the fiber under test. If set too low, the end-of-fiber reflection cannot be rendered; if set too high, the sampling resolution drops, obscuring macro-bends.
Pulse Width: This is the ultimate trade-off between Resolution and Dynamic Range.
Short Pulses (5ns, 10ns, 20ns): Provide ultra-short Event Dead Zones (down to 1.2 meters on G-Link TRP800), ideal for mapping short patch cords in data centers.
Long Pulses (1μs, 10μs, 20μs): Provide the high optical energy needed to penetrate high-attenuation components like 1×32 or 1×64 splitters, though they expand the attenuation dead zone.
📊 Reference Table: Standard OTDR Testing Parameters Configuration
4. How Do We Execute the Test and Leverage the Graphical Event Map?
Once parameters are set, toggle the test mode. We strongly advise using Average Mode (setting the timer to 30 or 60 seconds) rather than Real-Time Mode. Averaging allows the software to suppress random background noise, sharpening the trace slope for more precise fiber analysis.
The G-Link Innovation: Simplifying the Complex Trace
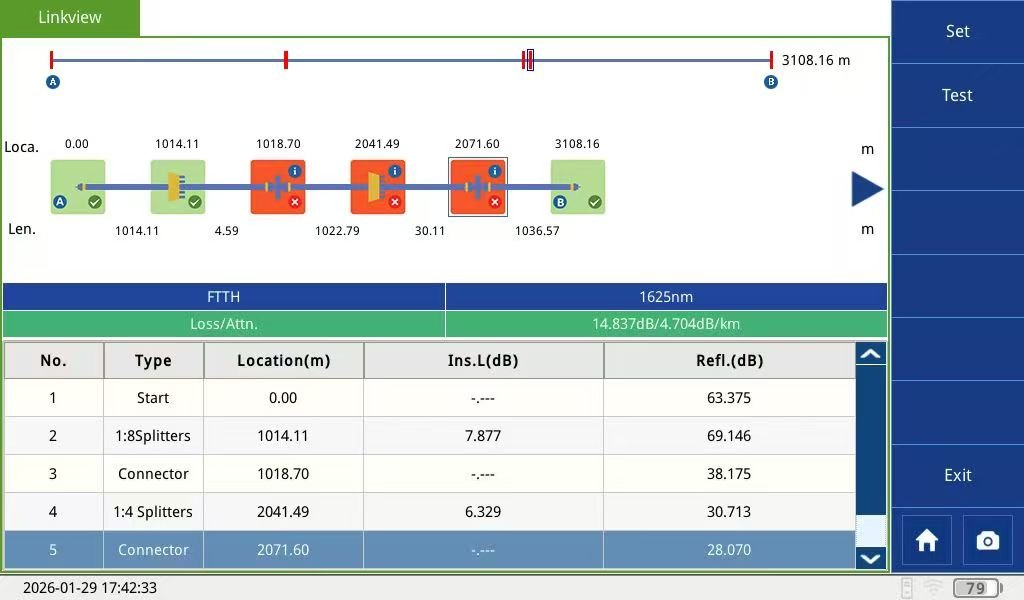
For decades, reading raw Rayleigh backscatter graphs required specialized engineering degrees. G-Link’s advanced software stack solves this bottleneck. Our TR600 and TR700 devices feature an automated Graphical Event Map (Link Image).
With a single tap, the complex waveform is translated into an intuitive linear icon sequence:
A Connector icon indicates bulkheads with precise pass/fail indicators.
A Splice icon flags fusion joints exceeding your loss thresholds.
A Scissors/Break icon points out the exact meter mark of a catastrophic fiber cut.

5. How to Read OTDR dB Readings and Analyze Link Losses?
When interpreting your final fiber optic otdr test report, you must understand the difference between reflective and non-reflective events along the linear attenuation line. So, what is a good fiber dB reading? Let’s break down the acceptable thresholds established by International Telecommunication Standards (ITU-T):
Linear Attenuation (The Downward Slope): Single-mode fiber should exhibit a clean, straight diagonal line dropping at approximately 0.35 dB/km at 1310nm and 0.20 to 0.22 dB/km at 1550nm. Any sudden increase in this slope indicates poor cable quality or environmental stress.
Non-Reflective Events (Sudden Steps Down): These represent fusion splices or macro-bends. A high-quality fusion splice performed by a professional fusion splicer should return a dB reading below 0.05 dB. Anything above 0.1 dB requires a re-splice.
Reflective Events (Sharp Upward Spikes): These signify mechanical connectors, patch panels, or the physical end of the fiber. While a reflection spike is normal, the insertion loss across that connector should strictly remain between 0.3 dB and 0.5 dB.
If your total cumulative link loss exceeds the budget calculated during network design, your field crew should immediately zoom into the trace to locate the exact distance marker showing localized high loss.
Professional Loss Standards Reference
| Event Type | Typical Acceptable Loss (dB) | G-Link Tech Note |
| Splice Loss | < 0.05 dB | Measured by TR700 High-Precision mode |
| Connector Loss | 0.3 dB – 0.5 dB | Depends on cleaning quality |
| Fiber Attenuation | ~0.2 dB/km (@1550nm) | Industry standard for SM fiber |
Evaluating Total Loss: If your dB reading is significantly higher than the calculated loss, there is an issue in the link. We recommend checking for tight bends or damaged jackets.
6. FAQ: Addressing Your Most Common Fiber Optic Testing Questions
Q: What is the primary difference between a TDR and an OTDR? A: A TDR (Time Domain Reflectometer) injects electrical pulses to pinpoint copper impedance changes or cable shorts. Conversely, an OTDR (Optical Time Domain Reflectometer) transmits high-power light pulses into optical fiber, analyzing Rayleigh backscatter and Fresnel reflections to map optical health.
Q: Can I use a standard OTDR for continuous fiber monitoring systems? A: Standard handheld OTDRs are designed for point-to-point manual troubleshooting. For 24/7 automated network security, telecom companies integrate specialized OTDR Module Systems with Matrix Optical Switches (OXC Systems) to build standalone remote fiber monitoring setups that scan core links constantly.
Q: Why does my 1550nm trace show a massive loss event, but the 1310nm trace looks perfectly clean? A: You are looking at a classic macro-bend (tight bend). Optical fibers bent beyond their minimum bending radius experience severe light leakage at 1550nm because longer wavelengths are less tightly confined to the core than 1310nm.
7. Conclusion: Ready to Eliminate Fiber Blind Spots in Your Network?
Mastering the otdr testing procedure is the single fastest way to slash your telecom maintenance overheads and ensure flawless broadband uptime. However, top-tier engineering workflows require instrumentation backed by decades of proven manufacturing reliability.
Don’t let hidden fiber blind spots degrade your network performance. G-Link’s comprehensive lineup of ISO-certified, rugged, touchscreen OTDRs is engineered to withstand harsh field environments while delivering laboratory-level trace accuracy.
🚀 Take Action Today to Optimize Your Fiber Infrastructure:
Need a Quick Quote? Drop your details below to receive our latest factory-direct catalog.
Facing a Complex PON Challenge? Click the floating WhatsApp button on the right to consult directly with a G-Link Senior Optical Engineer for a Free Network Topology & Testing Parameter Design!