Table of Contents
Most pages about a fiber optic cable monitoring system describe the software. This one shows what actually happens on screen when a cable fails.
Below is a 90-second screen recording of the G-Link TMS400 platform, taken during a live demo. We pull a fiber link at the far end and let the system do the rest: the dashboard updates, an alarm fires, and a single click opens the OTDR trace that tells you how far down the cable the break is.
No narration tricks, no mock-up graphics. Every screenshot in this article is a frame from that recording.
▶ Watch the full demo (90 seconds)
What This Fiber Optic Cable Monitoring System Demo Covers
| Time | What happens on screen | Why it matters to you |
| 0:00 | Log in to the monitoring platform | It runs in a browser — nothing to install on the NOC workstation |
| 0:10 | Dashboard shows devices, fiber routes, alarm status | You see the whole cable network before anything goes wrong |
| 0:15 | A fiber link is disconnected | This is the exact event every operator fears |
| 0:20–0:40 | The system detects the anomaly and raises an alarm, unprompted | Nobody was watching that link — the system was |
| 0:40–1:10 | The alarm appears in the real-time list and on the map | Operations can triage without calling the field |
| 1:14 | “View Curve” opens the OTDR trace | The alarm becomes a distance, not a guess |
That last row is the whole point. An alarm tells you something broke. A trace tells you where.
Step 1 — Logging In
The platform is B/S architecture: you open a browser, go to the server address, and sign in. There is no client software to install and no version to keep in sync across machines, which matters when your NOC has three shifts and five workstations.
The same platform can sit on a local server inside the station or on a cloud host — the login screen is identical either way.
Step 2 — The Dashboard: Devices, Routes, and Alarm Status at a Glance
Before the fault, this is what the operator sees.
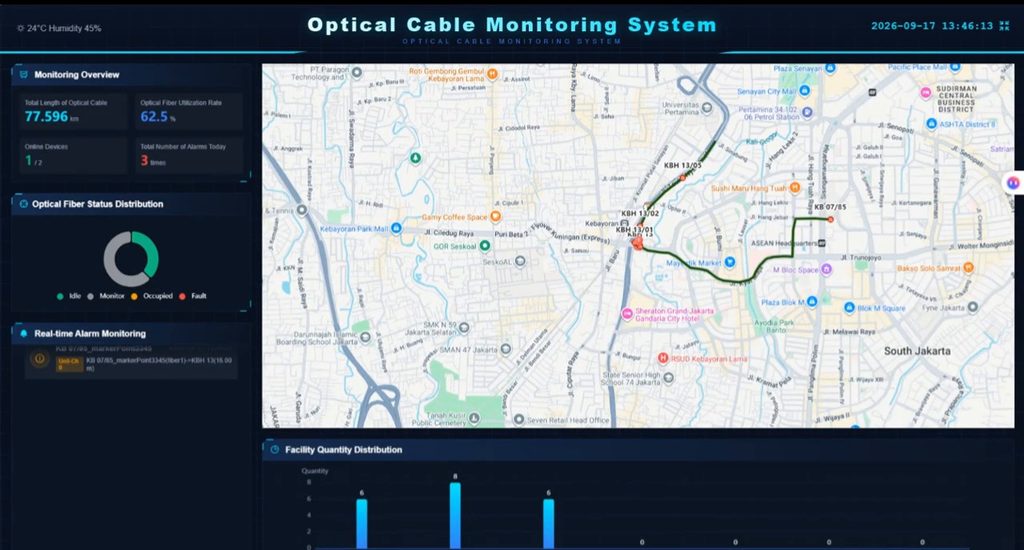
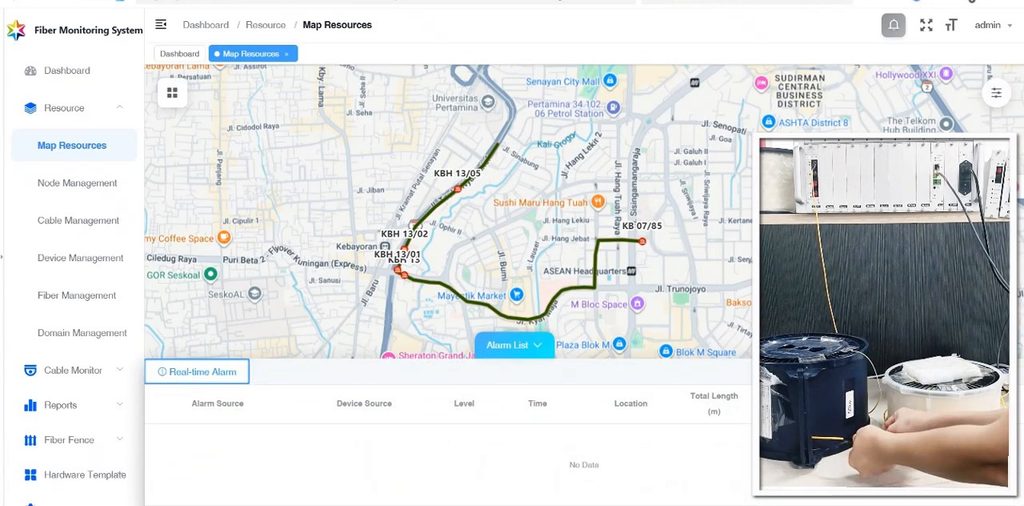
The left panel is the alarm column. The centre is a street map with the monitored cable routes drawn on top of it. Every marker is a monitored location — a splice closure, a hut, a substation — and every line between markers is a fiber route you are watching.
What the Map Is Actually Telling You
The map is not decoration. It exists so that the distance figure the OTDR produces can be turned into a place a truck can drive to.
- Markers carry the same IDs your field records already use (in this demo, names like
KBH 13/05andKB 07/85). - Lines are the cable spans between those points.
- Colour is status. A healthy span sits quiet in green; the moment a span fails, it is drawn in red so the eye finds it before the text does.
An operator does not need to know which closure is “KBH 13” — the map does that translation for them.
Step 3 — Pulling a Link: What Happens in the Next 30 Seconds
To simulate a real failure, the demo disconnects a fiber link at the far end — exactly what a backhoe does to a duct, minus the dust.
Nobody clicks anything. Within one automatic test cycle the system notices that the link no longer looks like it did, and raises the event on its own.
Why “Automatic” Still Depends on Your Test Cycle
This is the detail most vendors skip, and it is the one that decides whether your alarm arrives in one minute or in thirty.
The monitoring unit does not watch light continuously. It runs automatic periodic tests: it fires an OTDR pulse down a fiber, compares the returned trace against the stored reference, and moves on. How often that happens is a setting you choose.
Two consequences worth knowing before you buy:
- The test interval is your detection latency. A five-minute cycle means a break can sit unnoticed for up to five minutes. For a backbone link that is usually fine; for a link carrying a hospital or a payment gateway, tighten it.
- Fibers share one OTDR through an optical switch. A unit with one OTDR board and an 8-channel switch tests fibers one at a time, in rotation. Eight fibers on a five-minute cycle means each fiber is actually checked every forty minutes. If you need every fiber checked every five minutes, you need more OTDR boards — not a shorter setting.
Ask your supplier which of the two you are buying. A fiber optic cable monitoring system that quietly rotates 32 fibers behind one board is a very different product from one that tests all 32 in parallel.
Step 4 — Reading the Alarm: The Four Fields That Matter
The alarm that appears is deliberately short. Four fields, and each one answers a different question.
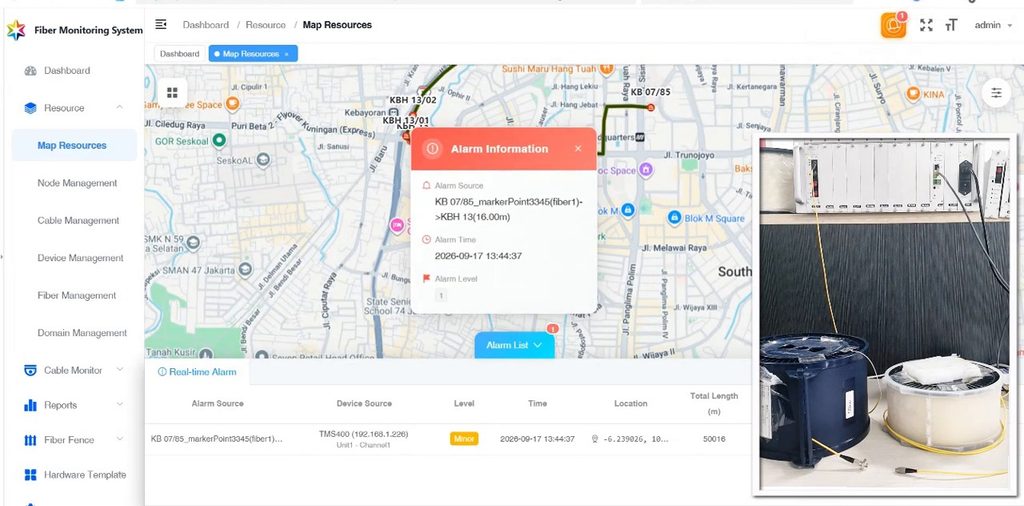
| Field | Example from the demo | What it answers |
| Alarm Source | KB 07/85_marker_Point3345(fiber1)->KBH 13(10.00m) | Which span, which fiber, and which direction the test ran |
| Alarm Time | 2026-09-17 13:44:37 | When the failure was detected — not when someone noticed |
| Alarm Level | Major | How hard this should ring in the NOC |
| Location + Total Length | coordinates + 50016 m | Roughly where, and exactly how far |
Total Length Is the Field Your Crew Actually Uses
50016 m is not a guess and it is not a cable-schedule number. It is the length of fiber the OTDR could still see at the moment it tested — which, on a broken span, is the distance to the break.
That single number is what turns a dispatch into a plan. Instead of “somewhere on the Jakarta ring”, the crew gets “fifty kilometres out, on this span”, and they can cross-check it against the splice records they already have for that route.
One caveat to keep in your head: the OTDR measures fiber length, not cable length. Because of stranding and slack, the fiber inside a cable is typically a few percent longer than the route on your drawings. Expect the number to be slightly larger than the map distance — it is not an error.
Step 5 — View Curve: From an Alarm to a Distance
One click on View Curve opens the trace for that exact fiber.
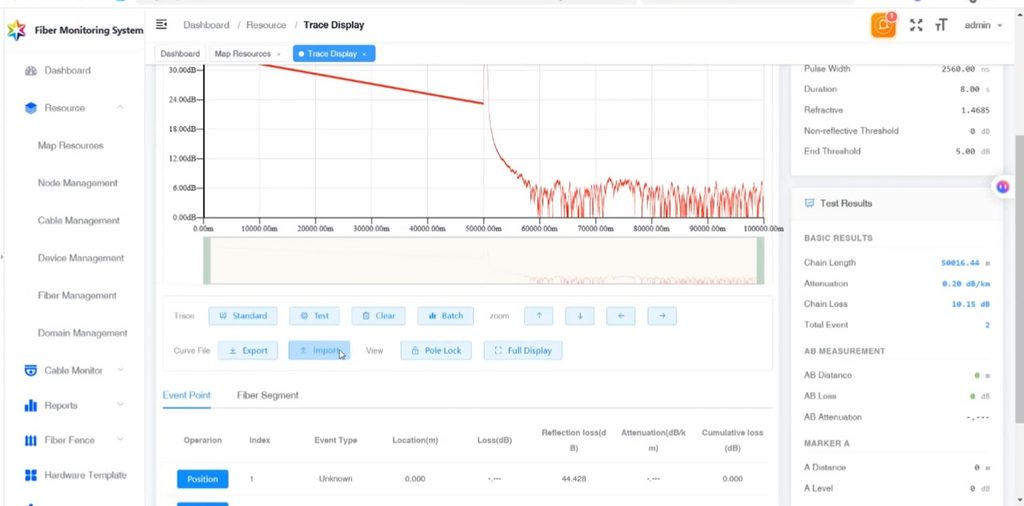
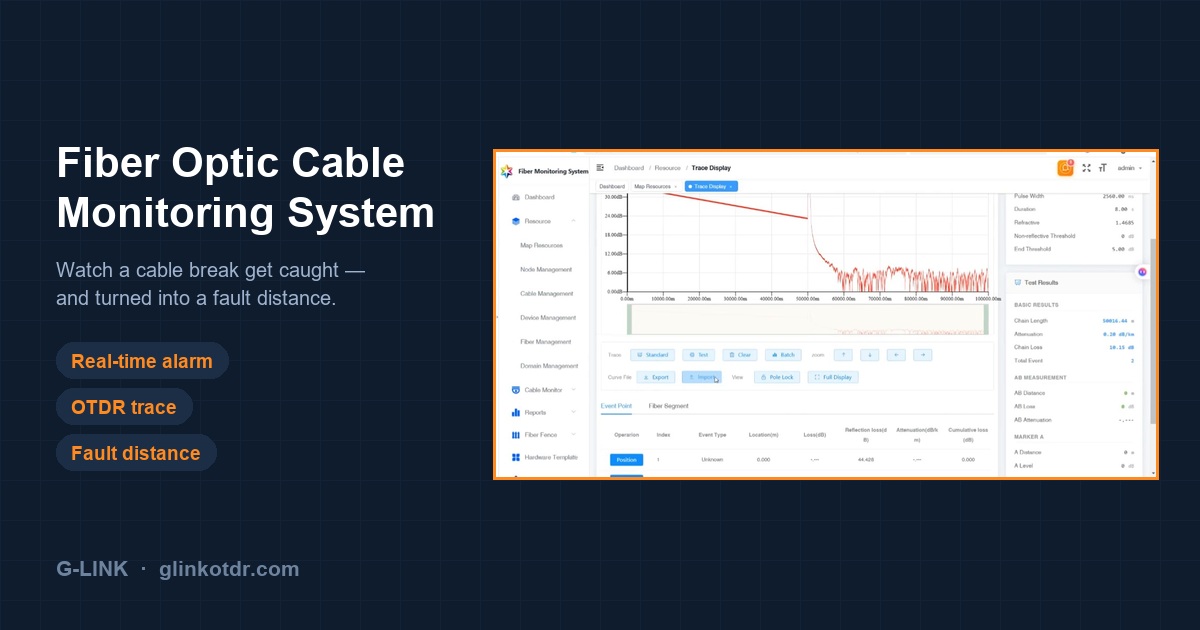
This is the same measurement the alarm was built from, now in front of a human. The horizontal axis is distance in metres; the vertical axis is returned power in dB. The red line runs almost flat from the start — that gentle downward slope is normal fiber attenuation — and then, at roughly 50 km, it collapses into noise.
The parameters used for this test are listed on the right:
| Parameter | Value in demo | Why it is set that way |
| Range | 100 km | Must exceed the span, or the far end is cut off |
| Pulse width | 2560 ns | Long pulse for long range; trades dead zone for reach |
| Wavelength | 1550 nm | Dark fiber test |
| IOR | 1.4685 | Converts time to distance — wrong IOR shifts every reading |
| Duration | 8 s | Averaging time; longer means a cleaner trace |
And underneath, the results:
| Result | Value |
| Chain Length | 50016.44 m |
| Attenuation | 0.20 dB/km |
| Chain Loss | 10.15 dB |
| Total Events | 2 |
Note that 50016.44 m matches the 50016 m in the alarm. The alarm and the trace are the same measurement — the alarm is simply the system telling you a number crossed a threshold.
What the Trace Shape Tells You
A healthy span usually ends with a sharp spike. That spike is a Fresnel reflection — light bouncing off the glass-to-air boundary at the far connector — and it is the easiest end-of-fiber signature there is to spot.
In this trace there is no spike. The line simply decays into noise and stops.
That shape means a non-reflective end: no clean cleave, no open connector, no mirror for the light to bounce off. In the field that is the signature of a pulled connector sitting in gel, a crushed cable, or a break under water — the failures where the fiber is not politely broken in half for you.
This is precisely why the trace matters and the alarm alone does not. The alarm told you the link was down. The trace tells you the character of the failure, which decides whether the crew brings a fusion splicer or a new connector housing.
H3: Reflective vs Non-Reflective Events — a 20-Second Primer
| Trace signature | Event type | Typical cause |
| Sharp spike above the backscatter line | Reflective | Connector, mechanical splice, clean break, fiber end |
| Step down with no spike | Non-reflective | Fusion splice, bend, or a break with no reflecting surface |
| Gradual slope change | Non-reflective | Cable under stress, water ingress, temperature drift |
| Trace ends with no spike | Non-reflective end | Crushed cable, pulled connector, submerged break |
Two events were detected on this trace. The one that matters is the one at 50 km, where the line ends.
How Accurate Is the Fault Location?
A fiber optic cable monitoring system is only as useful as the distance it reports. Here are the published figures for the OTDR module inside the unit:
| Specification | Value |
| Distance accuracy | ±(1 m + 5×10⁻⁵ × distance + sampling interval) |
| Sampling interval | 0.125 m |
| Event dead zone | ≤ 2 m |
| Attenuation dead zone | ≤ 5 m |
| Wavelengths | 1310 / 1550 / 1625 nm (±20 nm) |
| Dynamic range | 30–45 dB (43 dB typical for live-network builds) |
| Max range | up to 300 km |
At 50 km, the formula works out to about ±3.5 m. At 100 km, about ±6 m. That is far tighter than the accuracy of your cable records — which is the honest way to read it: the instrument is rarely the limiting factor, your as-built drawings are.
Two practical notes:
- Event dead zone ≤ 2 m means two events closer together than 2 m merge into one. A patch panel with back-to-back adapters will look like a single event.
- Attenuation dead zone ≤ 5 m means you cannot measure loss accurately on the first few metres after a strong reflection. Test through a launch cable if you care about the near end.
What This Fiber Optic Cable Monitoring System Cannot Do
Every honest page should have this section. Four limits decide whether the product fits your network at all.
1. The monitored path must be passive and point-to-point. The OTDR light cannot pass through an optical amplifier, a regenerator, or an active optical switch. If your link runs through PTN or OTN equipment with regeneration, you can only monitor the passive segment between two of those devices — not end to end.
2. Lit fiber needs a WDM in the path. Monitoring a fiber that is carrying live traffic requires a wavelength-division multiplexer at each end, injecting 1625 nm out of band while 1310/1550 nm traffic passes through untouched. Dark fiber needs no WDM at all — you connect it directly. This is the difference between lit fiber monitoring and dark fiber monitoring, and it changes your bill of materials.
3. One OTDR plus one switch is not simultaneous monitoring. As covered in Step 3, a single OTDR board behind an optical switch rotates through fibers. If your SLA requires every fiber checked on a tight interval, size the number of OTDR boards accordingly.
4. The alarm path must not depend on the fiber being monitored. This is the failure mode that catches people during commissioning. If the remote unit sends its alarms back over a link that runs on the same cable it is watching, then a cable cut kills the alarm along with the traffic — you find out when the customer calls.
The fix is boring and effective: give the remote unit its own backhaul. A local industrial 4G router, wired to the unit, gets alarms out over a completely separate path. It also sidesteps certification headaches, because the customer’s own certified router and SIM are already approved in-country.
What it cannot do at all: repair anything. It shortens the drive, not the outage.
What Hardware Sits Behind the Screen
The software is the visible half. The other half is a rack-mounted RTU at each end of the monitored span.
| Module | Role |
| Chassis (2U, 19″) | Holds the boards; dual AC 220 V / DC −48 V power |
| Control unit (MCU) | Runs the unit, talks to the NMS over 4G / Wi-Fi / Ethernet |
| OTDR board | The measurement engine — 1625 nm for live fiber, 1310/1550 nm for dark fiber |
| WDM module | Injects the 1625 nm test signal without disturbing traffic (≤1 dB insertion loss, ≥30 dB isolation) |
| Optical switch | Shares one OTDR across several fibers |
| NMS software | Browser-based: GIS map, topology, resource management, on-demand and periodic testing, alarm management, degradation analysis |
If you want the module-by-module explanation, it is in how TMS400 fiber monitoring works. The point here is simpler: the screen you just watched is the top of a stack that has to be specified correctly at the bottom.
Before You Ask for a Quote: Five Numbers
Every one of these changes the configuration of your fiber optic cable monitoring system, and none of them can be guessed from a product page.
- Longest span, in km. This sets the dynamic range. Get it wrong and the far end of the link is simply invisible.
- How many fibers are lit, and how many are dark. Lit fibers each need a WDM; dark fibers do not.
- Where the remote unit sits, and how it reaches the network. This decides whether you need a 4G router, a leased line, or a fibre drop of your own.
- Local server or cloud NMS. A cloud instance needs far less hardware than the on-premise recommendation.
- Who reads the alarm. SNMP trap into an existing NMS, REST API into Zabbix, SMS, or just the platform’s own dashboard.
If you can answer those five, the fiber monitoring guide will take you the rest of the way through architecture and sizing, and the TMS400 fiber monitoring system page carries the full specification.
FAQ
What is a fiber optic cable monitoring system?
It is a permanently installed OTDR that tests your cables on a schedule instead of on request. It fires a light pulse down each monitored fiber, compares the returning trace against a stored reference, and raises an alarm when the two no longer match — reporting the distance to the change. The difference from a handheld OTDR is not the measurement; it is that nobody has to drive out and connect one.
How fast does it detect a cable cut?
Detection time equals your configured test interval, plus the time the unit needs to analyse the trace. If a fiber is tested every five minutes, a break is reported within roughly five minutes. On units where several fibers share one OTDR through an optical switch, the effective interval per fiber is the cycle time multiplied by the number of fibers in the rotation. Ask for the per-fiber interval, not the headline cycle.
Can it monitor fiber that is carrying live traffic?
Yes, with a WDM at each end. The monitoring wavelength is 1625 nm, which sits outside the 1310/1550 nm service band, so the test light travels alongside your traffic without touching it. No service interruption is required to install or to test.
Does the monitoring light interfere with the service?
No. The WDM passes 1310/1550 nm traffic through with ≤1 dB insertion loss and ≥30 dB isolation from the 1625 nm test signal. The two wavelengths share the same glass without interacting.
If the cable is cut, how does the alarm get out?
Over a path that is independent of the monitored fiber — normally a 4G router at the remote site, or a separate Ethernet drop. This is a design requirement rather than a feature: if the alarm backhaul runs over the cable being monitored, a cut disables the alarm system at exactly the moment you need it.
Can it integrate with our existing NMS or Zabbix?
Yes. The platform exposes SNMP, SMTP, SMS, REST API and MQTT. Zabbix integration is done over REST API rather than SNMP trap; there is no off-the-shelf template, but a template can be built against the API.
How many fibers can one system monitor?
It depends on the chassis and the number of OTDR boards. A compact 1U unit typically carries one OTDR board and a 4-channel switch, so four fibers. Larger 2U chassis scale from 4 up to 32 channels, and higher-capacity frames reach 128. The constraint is the number of OTDR boards, not the switch — every fiber that needs simultaneous testing needs its own measurement engine.
Is the software a one-time purchase or a subscription?
One-time purchase, perpetual licence, bound to the server’s MAC address. There is no annual fee, and there is no cap on the number of network elements — one NMS instance manages every unit on the network. English and Chinese interfaces are standard.
See It on Your Own Network
The demo above runs on a lab setup. The same sequence — dashboard, alarm, trace, distance — is what your operators would see on a real span, with your own route names on the map.
If you want to check it against a specific link before committing to anything, send us the span length, the mix of lit and dark fibers, and how the site reaches the network. We will tell you which configuration actually fits, including the cases where a smaller unit will do.
G-Link manufactures OTDR instruments and fiber monitoring systems in Guilin, China. Certifications and test reports are listed on our quality certificates page.