
Table of Contents
It’s 2 a.m. A construction crew three towns away just put a backhoe through your backbone cable. Your NOC phones start ringing—not from your monitoring system, but from angry customers. Your technicians load a handheld OTDR into a van and start driving a 60-kilometer route, hunting for a break that could be anywhere.
If you run a fiber network, some version of this night has already happened to you. And it’s exactly the night that fiber monitoring is designed to eliminate.
We build fiber monitoring systems for a living, and we’ve watched operators cut their fault detection time from hours to under two minutes. This guide covers everything we’ve learned: what fiber monitoring is, how the technology works, dark vs. lit fiber strategies, what it really saves, and how to choose a system that fits your network.
What Is Fiber Monitoring?
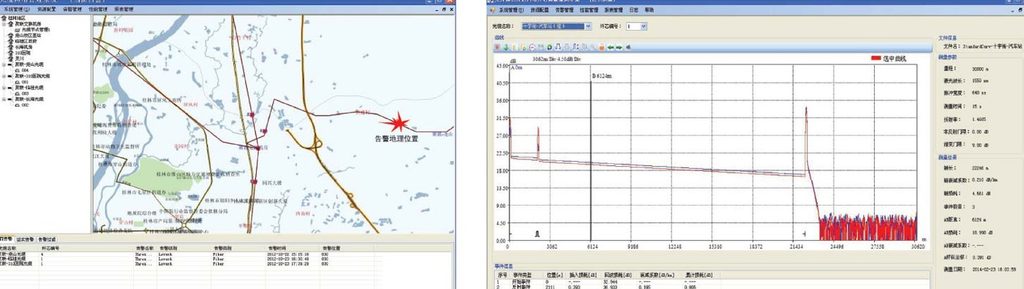
Fiber monitoring is the continuous, automated surveillance of a fiber optic network’s physical layer using OTDR-based Remote Test Units (RTUs). Instead of dispatching technicians after an outage, a fiber monitoring system scans every fiber 24/7, compares each result against a stored baseline, and raises an alarm with the exact fault location—typically within minutes.
The key word is continuous. Traditional maintenance is a snapshot: a technician tests a fiber, writes down the result, and leaves. Between visits, the network is invisible. A fiber monitoring system—often called an RFTS (Remote Fiber Test System) or FAMS (Fiber Automatic Monitoring System)—turns that snapshot into a live video feed.
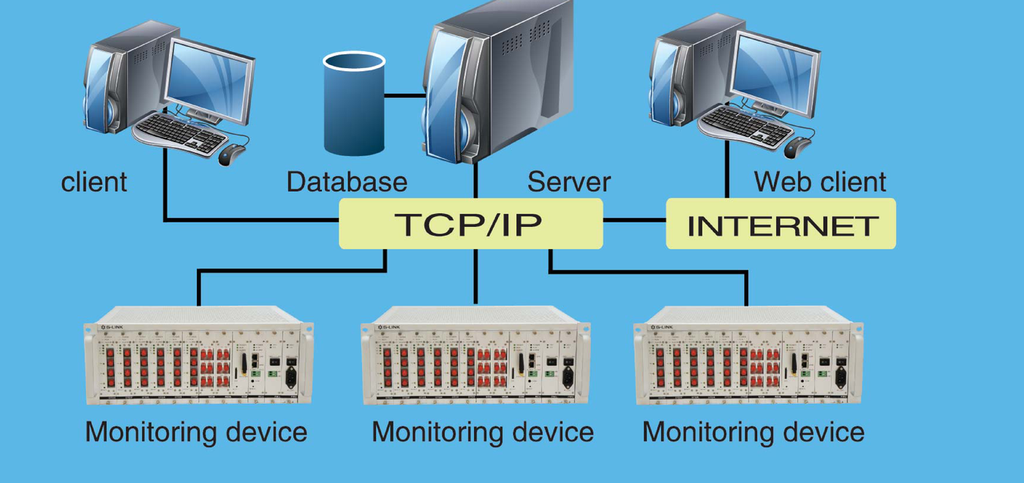
A complete system has four building blocks:
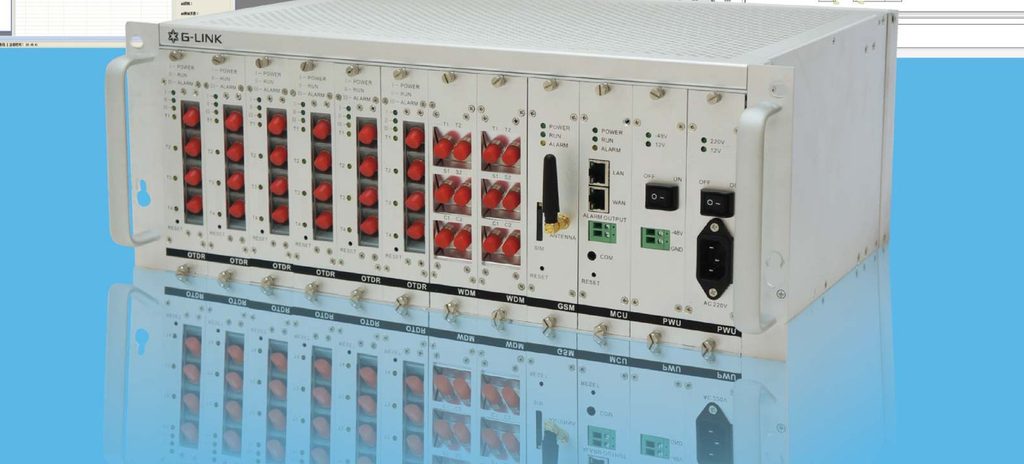
- RTU (Remote Test Unit): rack-mounted hardware with an integrated OTDR module, placed at central offices, aggregation nodes, or data centers.
- Optical switch: lets one RTU scan dozens or hundreds of fibers in rotation—32 channels in a 1U chassis, up to 144 in a 4U chassis.
- Central management platform (NMS): the software brain that schedules tests, stores baseline traces, analyzes deviations, and manages alarms and user roles.
- GIS mapping: overlays fiber routes on a live map, so an alarm isn’t just “break at 23.4 km”—it’s a pin on a map your crew can drive to.
Our own G-Link FAMS fiber monitoring system follows this exact architecture, and it’s the reference point for the examples in this guide.
Why Has Fiber Monitoring Become a Must-Have in 2026?
Five years ago, fiber monitoring was a “nice-to-have” for premium backbone links. Three forces have made it baseline infrastructure:
1. Networks got denser, tolerances got tighter. FTTH rollouts, 5G backhaul, and data center interconnects mean more fibers carrying more revenue per strand. A single cut that once inconvenienced a few hundred subscribers now takes down cell sites, enterprise SLAs, and payment systems at once.
2. SLAs got teeth. Regulators and wholesale customers now write real penalties into contracts. When every hour of outage has a price tag, “we’ll find it in the morning” is a business decision—with a cost line.
3. The economics flipped. RTU hardware and optical switches have commoditized, while skilled field labor has gotten scarcer and more expensive. The truck roll you avoid pays for the channel you monitor.
The market data agrees: analysts tracking the fiber monitoring market highlight AI-driven predictive maintenance—algorithms that spot degradation patterns before the break—as the defining trend of this cycle, with Asia-Pacific the fastest-growing region thanks to 5G and national broadband programs. In India, for example, remote fiber monitoring has shifted from optional to mandatory thinking for operators building out BharatNet and FTTx at scale. Standards bodies anticipated this years ago: ITU-T recommendation L.41 reserved the 1625nm and 1650nm windows specifically for in-service maintenance testing.
How Does Fiber Monitoring Work?
A fiber monitoring system works in three steps: RTUs inject low-power OTDR test pulses into each fiber on a schedule; the central platform compares every trace against a stored reference baseline; and any deviation triggers an alarm with GIS coordinates, so crews go straight to the fault instead of searching for it.
Here’s the workflow in practice:
Step 1 — Continuous scanning. The RTU’s OTDR board sends test pulses down each fiber through the optical switch. On dark (unused) fibers, testing runs at 1310nm or 1550nm for maximum precision. On live fibers, the system uses 1625nm or 1650nm—a “maintenance wavelength” outside your traffic bands, combined onto the fiber through a WDM coupler, so customers never feel the test.
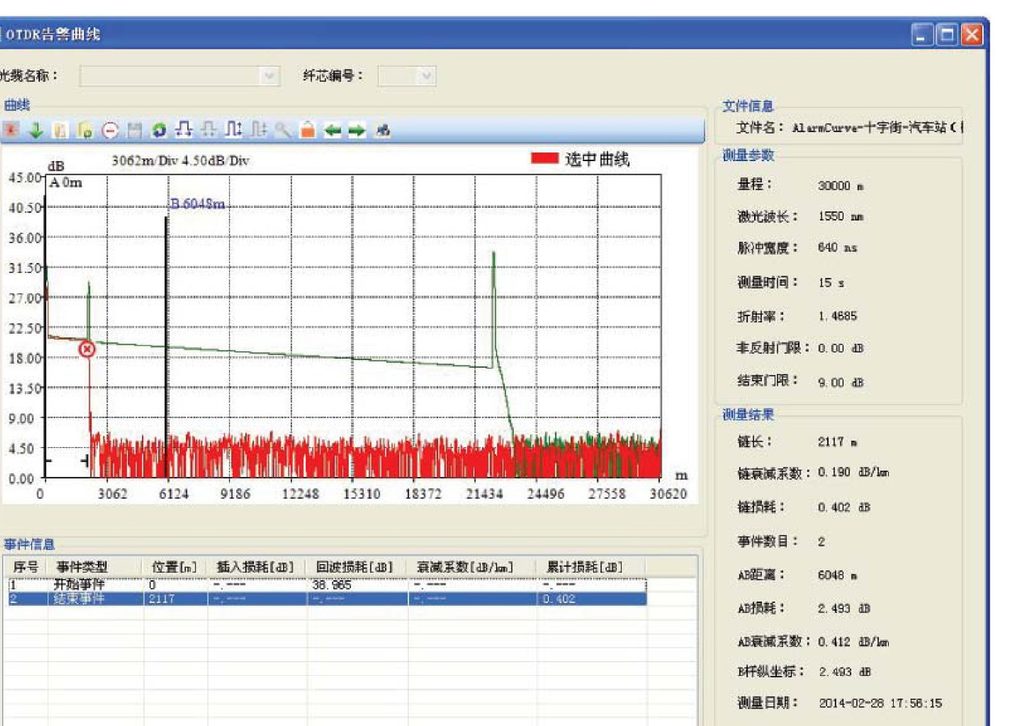
Step 2 — Baseline comparison. Every new trace is compared against the reference trace captured at commissioning. The Fiber Optic Association describes OTDR as the standard tool for locating loss events in fiber; a monitoring system simply automates that comparison thousands of times per day, with algorithms filtering real events from noise.
Step 3 — Alarm and localize. When a deviation crosses a threshold, the platform calculates the distance to the event, converts it to GIS coordinates, and pushes an alert—dashboard, SMS, email, or northbound into your OSS via SNMP. Tiered alarm levels mean a 0.5 dB splice degradation and a full cut don’t land on the same desk with the same urgency.
One detail buyers consistently underestimate: PON networks. Each doubling of split ratio costs roughly 3 dB of budget, so a 1:32 split eats ~15 dB before fiber attenuation even starts. Monitoring through splitters demands high-dynamic-range OTDR boards—our TMS400 RTUs use 38/40/45 dB modules and can test through splitters up to 1:128. We break down the full signal flow in how TMS400 fiber monitoring works, and the software side lives on our optical network management platform page.
Dark Fiber vs. Lit Fiber Monitoring: Which Do You Need?
Dark fiber monitoring tests unused spare fibers at 1310nm or 1550nm, while lit (in-service) fiber monitoring tests live, traffic-carrying fibers at 1625nm or 1650nm through a WDM coupler—so testing never interferes with customer data. Most mature operators deploy a mix of both.
| Decision factor | Dark fiber monitoring | Lit fiber monitoring |
| Wavelength | 1310nm / 1550nm | 1625nm / 1650nm (ITU-T L.41) |
| Extra hardware | None beyond RTU + switch | WDM couplers / filters |
| What you learn | Cable plant health (indirect) | The actual traffic path (direct) |
| Install disruption | Zero—never touches live service | Brief, at coupler installation |
| Best for | New builds, spare-rich routes | FTTH, 5G backhaul, DCI, SLA-critical links |
The honest answer we give operators: if your cables have spare cores and your main risk is physical damage to the cable itself, dark fiber monitoring covers most of your risk at lower cost. If your SLAs are tied to specific live services—or spare cores are scarce—lit fiber monitoring is worth the WDM hardware. Our lit fiber monitoring guide walks through the wavelength science and WDM design in detail.
What Faults Can a Fiber Monitoring System Detect?
More than most people expect. Beyond the obvious clean break, continuous OTDR surveillance catches:
- Fiber cuts and breaks — the 2 a.m. backhoe, localized to within ±10 meters plus distance error.
- Macro-bends — a cable pinched by sloppy installation or stressed by ice and wind on aerial spans. The 1625/1650nm wavelengths are especially bend-sensitive, so you see the stress before the snap.
- Splice and connector degradation — slow loss creep from aging closures, vibration, or a contaminated connector, trended over weeks.
- Water and moisture ingress — attenuation spikes in manholes and handholes with failing seals.
- Unauthorized tapping — unexpected loss events on strategic routes that shouldn’t have any.
- Vibration and third-party intrusion — digging or tampering near the cable, flagged before physical damage occurs.
That last row is why fiber monitoring increasingly shows up in security budgets, not just maintenance budgets—border crossings, pipelines, and railway corridors use it as an intrusion early-warning layer.
How Much Can Fiber Monitoring Save You?
The savings show up in three places: fault detection time, dispatch efficiency, and eliminated routine testing. Here’s the comparison we walk through with every prospective customer, based on field data from our own deployments:
| Metric | Manual maintenance | Automated fiber monitoring |
| Fault detection | 0.5–2 hours (after someone notices) | ≤ 2 minutes, automatic |
| Fault localization | Drive the route, test, re-test | GIS pin, ±10 m, first dispatch correct |
| Repair crew dispatch | 2 people + vehicle, exploratory | Direct to location, right equipment |
| Routine line testing | Quarterly, manual, per-technician | Automatic scheduled scans, zero labor |
| Records | Spreadsheets, tribal knowledge | Baseline + trend history, self-updating |
Two real numbers from our case files: one carrier cut MTTR from 8 hours to 4 hours purely by removing the search phase—crews drive to coordinates instead of hunting. Another operator reported a 70% reduction in fault detection time, with the system reporting issues before subscribers called. A remote power utility deployed a 96-core RTU (later expanded to 128 cores in the same chassis) and effectively eliminated routine site visits to unmanned substations. The full stories are in our real-world TMS400 FAMS results write-up.
A useful mental model: fiber monitoring doesn’t make repairs faster—it deletes the finding phase, which is usually the longest and most expensive part of an outage.
How Do You Choose the Right Fiber Monitoring System?
Before comparing vendors, write down what the system must actually do. The checklist we use with buyers:
| Criterion | What to ask | Why it matters |
| Dynamic range | 38–45 dB available? | Determines reach and whether you can see through PON splitters |
| Channel capacity | 32/128/144 per chassis? Cascadable? | Cost per monitored fiber; headroom for growth |
| In-service support | 1625/1650nm + WDM options? | Mandatory if you’ll ever test live fibers |
| PON capability | Test through splitters to what ratio (single-stage + multistage)? | 1:32+ splits blind low-range systems (TMS400: 1:32 single-stage, 1:128 multistage PON) |
| Dead zones | Event dead zone ≤ 1 m on P2MP, ≤ 4 m on P2P? | Short links and near-end faults need it (TMS400: 1 m event / 4 m attenuation on P2MP, 4 m / 10 m on P2P) |
| Integration | SNMP / SMTP / SMS northbound? | Alarms must land in your existing NOC, not a new silo |
| GIS & records | Native mapping, baseline trending? | The difference between “alarm” and “dispatch order” |
| Vendor depth | Manufacturer or reseller? Customization? | Topology design, firmware, and spares for a 15-year asset |
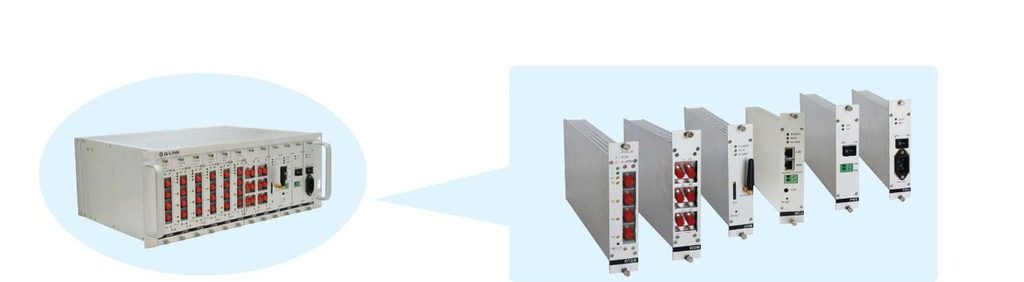
One question exposes weak vendors fast: “Show me a trace from a live PON behind a 1:32 splitter—then a multistage cascade.” Many systems can’t see past the first split, because their dynamic range or PON passthrough support stops there. The TMS400 tests through 1:32 single-stage splitters and up to 1:128 multistage PON.
If you’d like a second set of eyes on your topology, our engineers design monitoring layouts for networks from a single metro ring to national backbones—see the TMS400 FAMS hardware options, or contact our engineering team with your route map.
How G-Link’s TMS400 Compares to Typical Alternatives
Generic alternatives look alike on paper, but four specs decide whether a deployment actually works: chassis density per rack, dead-zone performance on PON links, built-in intelligent fault analysis, and the ability to monitor through multistage splitters. On all four, the G-Link TMS400 leads the comparison below.
The table below is drawn from G-Link’s 2025 FAMS solution brief, benchmarking TMS400 against two representative single-vendor alternatives on the specs that matter for real PON and backbone networks:
| Spec | G-Link TMS400 | Typical Alternative A | Typical Alternative B |
| Chassis sizes | 4U / 2U / 1U | 2U / 1U | 2U / 1U |
| Channel capacity | 144 / 128 / 64 / 32 / 16 / 4 | 96 / 64 / 32 / 16 | 128 / 64 / 32 / 16 |
| Monitoring wavelength | 1625nm / 1550nm (customizable) | 1625nm / 1550nm | 1625nm / 1550nm |
| OTDR dynamic range | 45 / 40 / 38 / 36 / 32 / 30 dB | 40 / 38 / 36 dB | 40 / 38 / 36 dB |
| Dead zone (P2MP / P2P) | 1 m / 4 m event, 4 m / 10 m atten. | 4 m / 12 m | 4 m / 12 m |
| Scenarios supported | P2P + P2MP (PON) | P2P only | P2P only |
| Intelligent link analysis (iAM) | Yes—proprietary algorithm | Not available | Not available |
| Passthrough splitter | 1:32, multistage 1:4 / 1:8 PON | Not available | Not available |
| Monitoring mode | Active OTDR monitoring | OPM-triggered OTDR | OPM-triggered OTDR |
What the rows actually mean for you: the 4U chassis and 144-channel density let one rack monitor a full metro ring without sprawl; the 1 m / 4 m dead zone on P2MP links catches near-end faults that 4 m / 12 m systems miss; and iAM plus multistage PON passthrough are the two capabilities most alternatives simply don’t ship—so if your network is PON-heavy or you need predictive analysis, the shortlist narrows quickly. (Note: “Alternative A / B” are anonymized from the vendor-neutral benchmarking in G-Link’s brief; specs are published comparator data, not a claim about any named competitor.)
The comparison also exposes an architecture choice most buyers never see. Traditional monitoring systems pair an optical power module (OPM) with an optical switch and only fire the OTDR when optical power drops. That design carries three structural costs: it needs two fibers per monitored cable (one for the OTDR, one for power detection) while a multi-channel OTDR needs only one; it requires an active light source at the far end while multi-channel OTDR tests from a single end; and a single failed OTDR in a traditional shelf can black out monitoring for a large bank of cables, whereas in the TMS400 each OTDR module serves only its own fibers. That is why the “Monitoring mode” row—not just the headline specs—should drive your shortlist.
What’s Next: Fiber Monitoring and Distributed Fiber Sensing
The boundary between “monitoring” and “sensing” is dissolving. Distributed acoustic sensing (DAS) turns the cable itself into a thousands-of-kilometers microphone—Verizon and NEC have field-validated hybrid sensing across ~500 km of live carrier fiber in Dallas, and Italy’s FiberCop is trialing Nokia’s Sensornet for predictive maintenance on its national network.
For operators planning systems today, the practical takeaway isn’t “wait for DAS.” It’s: choose a monitoring platform whose RTUs and software can grow into sensing. OTDR-based monitoring and DAS share the same fiber plant, and vibration-aware monitoring—already standard on our TMS400—sits on the evolutionary path between the two.
FAQ
Does fiber monitoring interrupt live traffic?
No. In-service monitoring uses a 1625nm or 1650nm test wavelength combined with your traffic through a WDM coupler. The wavelengths never overlap, so OTDR scans run during peak hours with zero packet loss or service disruption.
How accurate is fiber fault localization?
With high-precision OTDR boards, typical localization error is under ±10 meters plus the distance error coefficient—accurate enough for a crew to start digging at the first pin instead of surveying the route.
Can a fiber monitoring system integrate with our existing NMS/NOC?
Yes. Standard systems support SNMP, SMTP, and SMS northbound interfaces, so alarms flow into your existing operations center rather than a separate dashboard.
What’s the difference between fiber monitoring and a handheld OTDR?
A handheld OTDR tests one fiber when a technician is on site. A fiber monitoring system tests every fiber, all the time, from the NOC—and compares each trace against history to catch slow degradation a one-off test would miss. The two are complementary: monitoring finds the fault, the handheld verifies the repair.
How many fibers can one system monitor?
A single RTU chassis handles 32 to 144 channels through its optical switch, and chassis can be cascaded for thousands of fibers. Modular sizing means you start with your critical routes and expand without forklift upgrades.
Is fiber monitoring worth it for a smaller network?
Run the truck-roll math: if you dispatch field crews more than a handful of times per year, or any single outage carries an SLA penalty, the payback period is typically measured in months, not years. Smaller networks often start with one RTU on their most critical route.
Stop finding out about fiber cuts from your customers. The G-Link TMS400 FAMS platform combines 45 dB OTDR boards, 144-channel scalability, PON passthrough to 1:32 (single-stage) and 1:128 (multistage), and GIS localization in one integrated system—backed by 50 years of optical R&D at the CETC 34th Research Institute and ISO 9001/14001/45001 certified manufacturing.