
Table of Contents
A technician stands at a fiber distribution hub at 9 p.m. A dozen customers on one PON just went dark. The power meter says the OLT is fine. Somewhere between the splitter and those twelve homes, the fiber is broken, bent, or badly spliced—and the only instrument that can tell him where, without digging up the whole street, is the one in his hand.
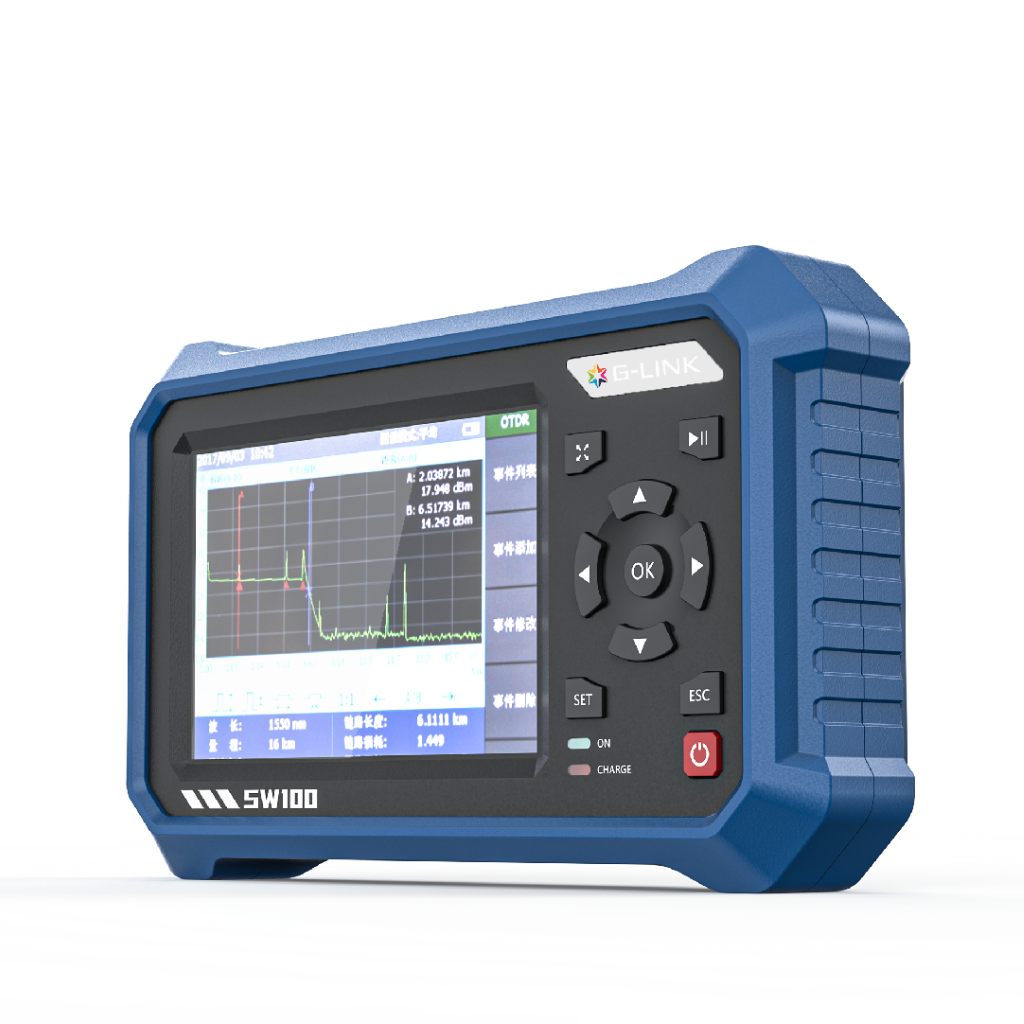
That instrument is an OTDR, and knowing how to use it is what separates a 20-minute fix from an all-night search.
We manufacture OTDRs and fiber monitoring systems, and we train carrier field teams on OTDR testing every month. This guide is everything we teach: what OTDR testing is, how the physics works, how to read a trace like a veteran, the dead-zone mistakes almost everyone makes once, how to test live PON networks safely, and how to pick the right instrument for your job.
What Is OTDR Testing?
OTDR testing is a single-ended fiber measurement technique: an Optical Time-Domain Reflectometer sends laser pulses down a fiber and analyzes the light that returns, producing a trace that maps every connector, splice, bend, and break along the link—plus the fiber’s own attenuation. Unlike a simple power-meter loss test, OTDR testing tells you where each event is and how much it contributes.
That last distinction is the whole point. An optical loss test set (OLTS) gives you one number for the entire link. OTDR testing gives you the link’s biography—every event, its distance, and its cost in decibels.
From a single trace, OTDR testing reports:
| Measurement | What it tells you |
| Fiber attenuation | Loss per kilometer along the fiber (dB/km) |
| Splice loss | Loss at each fusion or mechanical splice |
| Connector loss | Loss at each connector or mating point |
| Reflectance | Strength of reflection at each event |
| Optical return loss (ORL) | Total reflected light for the whole link |
| Distance to event | Exact location of each connector, splice, or fault |
If you’re brand new to the instrument itself—form factors, components, and how it evolved—start with our ultimate guide to OTDRs, then come back here for the testing discipline.
How Does an OTDR Work?
An OTDR works by timing two kinds of returning light: Rayleigh backscatter, a faint continuous reflection from the glass itself that reveals attenuation, and Fresnel reflections, strong returns from abrupt changes in refractive index—connectors, splices, breaks—that reveal discrete events. Because the speed of light in glass is known, the round-trip time of each return converts directly into distance.
Two physical effects do all the work:
- Rayleigh backscatter. Microscopic variations in the glass scatter a tiny fraction of the pulse in all directions; a sliver of it travels back toward the OTDR. In a healthy fiber, that returning light is roughly one-millionth of the launched pulse—yet measuring it along the full length is how the instrument calculates attenuation.
- Fresnel reflections. Wherever the refractive index changes abruptly—a connector, a mechanical splice, an air gap, a break, the fiber end—a much stronger reflection bounces back. These appear as spikes and let the OTDR pinpoint each event’s location.
The distance math is simple: distance = (speed of light × round-trip time) ÷ (2 × fiber refractive index). Set the wrong IOR (index of refraction) and every distance on your trace shifts—one of the most common setup errors we see. The Fiber Optic Association publishes the reference values for common fiber types.
One more working principle matters in practice: averaging. The OTDR fires thousands of pulses and averages the returns to pull the signal out of the noise. Longer averaging means a cleaner trace—essential on long, high-loss spans.
How Do You Read an OTDR Trace?
Reading an OTDR trace means recognizing six shapes: the downward backscatter slope (normal attenuation), reflective spikes (connectors), non-reflective steps down (splices and bends), gainers (fiber-mismatch artifacts), the end-of-fiber reflection, and ghosts (false double-distance reflections). Once you can name the shape, you can name the event.
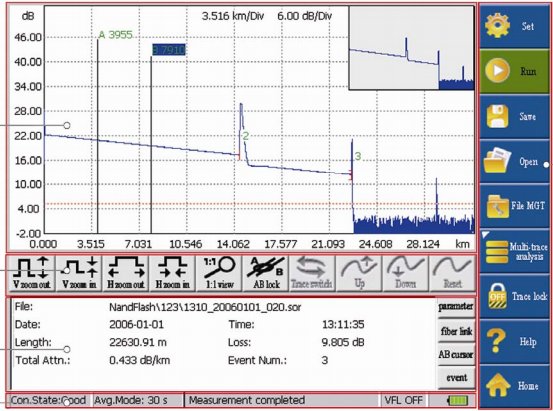
Here’s the field decoder we give every new technician:
| Trace shape | What it is | What “good” looks like |
| Gentle downward slope | Normal fiber attenuation | ~0.35 dB/km at 1310nm, ~0.20 dB/km at 1550nm (G.652D) |
| Sharp spike up | Reflective event—connector or mechanical splice | Connector loss 0.2–0.5 dB; reflectance ≥ −40 dB (UPC), ≥ −60 dB (APC) |
| Step down, no spike | Non-reflective event—fusion splice or bend | Good fusion splice ≤ 0.1 dB; investigate > 0.3 dB |
| Step up | “Gainer”—backscatter mismatch between two fibers | An artifact, not amplification; verify bidirectionally |
| Large spike, then noise | End of fiber—or a break | Spike before the expected end = fault location |
| Spike at ~2× a real event’s distance | Ghost—double reflection between two connectors | Not real; disappears after cleaning/replacing reflective connectors |
Two rules prevent most misreads. First, always locate the end of fiber before analyzing events—if the trace dies in noise before the expected end, that’s your fault, full stop. Second, never trust a single-direction splice loss: different backscatter coefficients on either side of a joint distort the reading, which is why standards require bidirectional testing with averaged results.
For the full hands-on workflow—setup, acquisition, event marking, and documentation—follow our step-by-step OTDR test procedure.
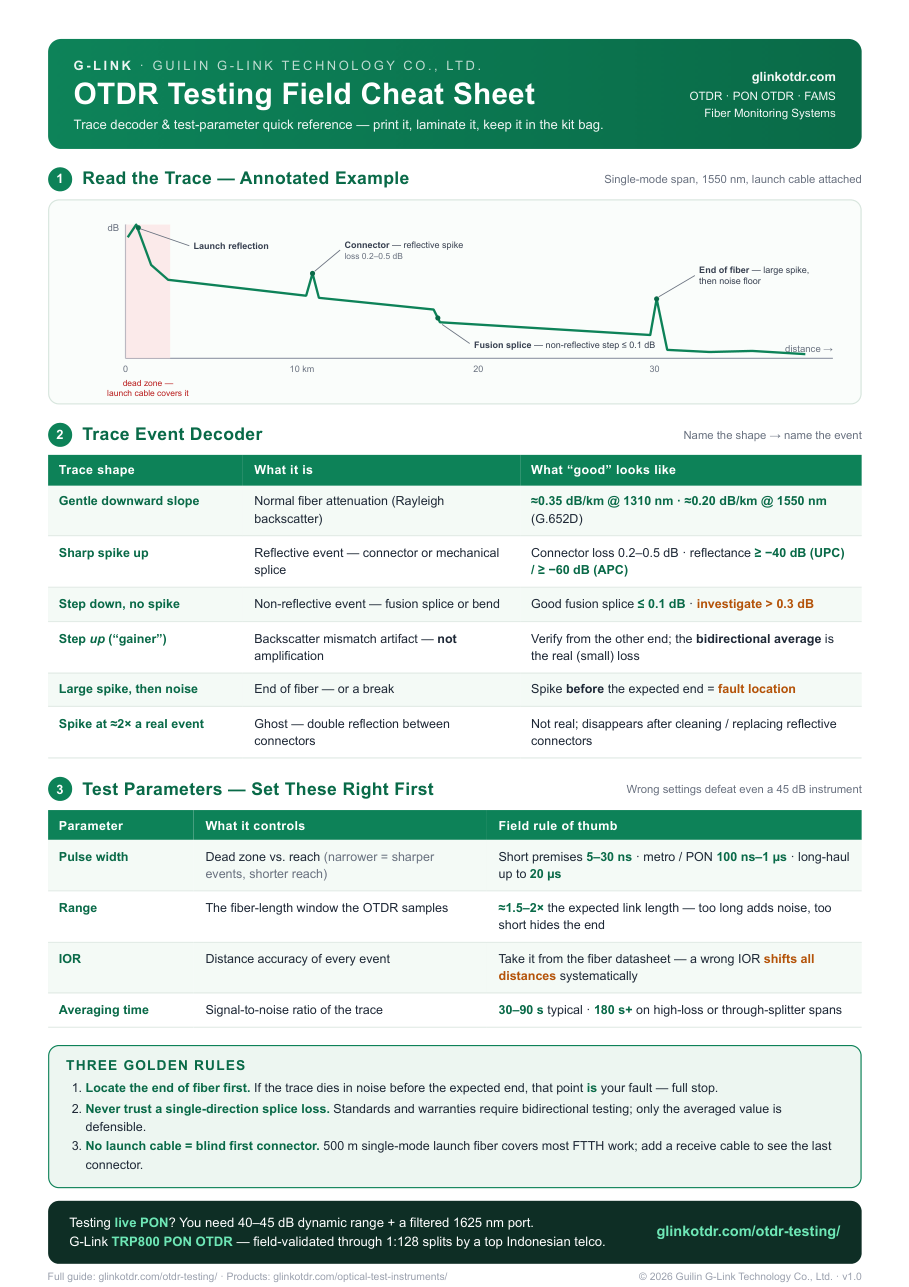
Free Download: OTDR Testing Field Cheat Sheet
The two tables our field techs actually keep in their truck:
- Trace event decoder — 6 trace shapes, what the event is, what “good” looks like
- Test parameters — pulse width, range, IOR, averaging time, with field rules of thumb
One page. Print it, tape it inside your instrument case.
What Are Dead Zones, and Why Do You Need a Launch Cable?
A dead zone is the stretch of fiber after a strong reflection where the OTDR is temporarily blind and cannot resolve or accurately measure another event. Event dead zone (EDZ) is the minimum distance to detect a second event; attenuation dead zone (ADZ) is the longer distance to measure it accurately. A launch cable pushes the dead zone off your link so the first connector becomes measurable.
This is the single most common OTDR testing mistake in the field: connect the instrument straight to the link, and the OTDR’s own output connector creates a massive reflection right at distance zero. Everything within the dead zone after it—often your most important connector—is invisible.
The standard fix is a known-good length of fiber between instrument and link:
- Multimode: launch cables of 150 m or more
- Single-mode: 500 m–1 km is typical (FTTH work often uses 500 m)
- Receive cable at the far end: same idea in reverse, so you can measure the last connector instead of watching the trace fall off a cliff
Dead zones shrink with narrower pulse widths—but narrower pulses carry less energy and reach shorter distances. That trade-off is why experienced techs test short runs twice: a narrow pulse for near-end detail, a wide pulse for full length.
Which Wavelength Should You Test At: 1310, 1550, or 1625nm?
Test single-mode fiber at both 1310nm and 1550nm—1550nm is more bend-sensitive, so a fault invisible at 1310nm often appears clearly at 1550nm. Reserve 1625nm or 1650nm (filtered) for testing live, traffic-carrying fibers, because those wavelengths sit outside the active signal bands.
| Wavelength | Use it for | Watch out for |
| 850nm / 1300nm | Multimode (OM1–OM5) | Never mix with single-mode settings—loss readings will be wrong |
| 1310nm | Single-mode baseline, short spans | Can hide macro-bends |
| 1550nm | Single-mode, long spans, bend detection | Slightly higher fiber attenuation is normal |
| 1625nm / 1650nm (filtered) | Live fiber—in-service PON and backbone | Requires a filtered port; never fire in-band wavelengths at live traffic |
The bend-detection trick is worth memorizing: run the same span at both wavelengths. A location showing small loss at 1310nm but large loss at 1550nm is almost always a macro-bend, not a splice problem. And the live-fiber rule is absolute—ITU-T reserved the 1625/1650nm window for in-service maintenance precisely because firing 1310/1490/1550nm into a live PON knocks customers offline.
How Do You Test Live PON Networks Without an Outage?
Testing a live PON requires a filtered 1625nm (or 1650nm) OTDR wavelength that never overlaps the 1310/1490/1550nm traffic bands, plus enough dynamic range to see through splitters—each doubling of split ratio costs roughly 3 dB, so a 1:32 split eats about 15 dB before fiber attenuation even starts. Multi-pulse acquisition and intelligent link mapping turn that into a routine field job.

PON is where ordinary OTDR testing breaks down, for three reasons:
- Splitters are loss walls. Most standard handhelds (24–28 dB dynamic range) go blind at the first splitter. Seeing through 1:64 or 1:128 cascaded splits demands 40–45 dB-class instruments.
- Downstream traces are ambiguous. After a splitter, the trace branches into 32 or 64 paths—one downstream trace can’t tell you which drop failed. The professional move is testing upstream from the affected drop fiber, which keeps the topology point-to-point.
- One pulse width can’t see everything. Our internal PON test data shows why: a 10ns pulse resolves near-end splices, a 40ns pulse cleanly locates the 1:8 splitter, and a 1280ns pulse is what it takes to punch through second-stage splitters to the fiber end. Modern PON OTDRs automate this—cycling multiple pulse widths and merging the results into one event map.
That’s the workflow we built into the TRP800 PON OTDR: a dedicated filtered 1625nm port, an FTTH mode that runs the multi-pulse sequence automatically, and an icon-based link map instead of a raw trace—validated in the field when a top Indonesian telco put it through live-network testing. The full technique is in our 1625nm live fiber troubleshooting guide.
One strategic note: a handheld OTDR tells you where the fault is when you go looking. If you need to know the moment it happens—24/7, without dispatching anyone—that’s a different architecture: continuous fiber monitoring with rack-mounted OTDR test units. Most mature operators run both: monitoring finds it, the handheld confirms the repair.
OTDR vs. Power Meter: What Do Tier 1 and Tier 2 Certification Require?
Tier 1 certification uses an OLTS (light source + power meter) to measure total insertion loss, length, and polarity—it’s mandatory and gives one end-to-end number. Tier 2 adds OTDR testing to characterize every event individually, and standards treat it as a supplement, never a replacement: an OTDR-only acceptance test is non-compliant.
The two instruments answer different questions, and certification frameworks (IEC 61280-4-1/4-2, ISO/IEC 14763-3, TIA-568.3) are explicit about it:
| Tier 1 (OLTS) | Tier 2 (adds OTDR) | |
| What you get | Total link loss, length, polarity | Every event’s location, loss, and reflectance |
| Can it miss a bad splice? | Yes—a good connector can mask a bad one | No—events are measured individually |
| Standards status | Mandatory for certification | Required when the spec calls for it (OSP, long links, warranty) |
| Bidirectional required? | Recommended | Yes—standards and most warranties mandate it |
The practical takeaway: certify with both. A link can pass Tier 1 on total loss while hiding a high-reflectance connector that will degrade 100G/400G links later. Our OTDR network certification guide walks through a compliant FTTx certification workflow, and the underlying test methods are defined by the IEC 61280 series.
What OTDR Specs Actually Matter?
Four specs decide whether an OTDR fits your work: dynamic range (how far and through how much loss you can see), dead zones (how close together events can be), wavelength coverage (especially a filtered 1625/1650nm live-fiber port), and intelligent analysis (event maps that turn traces into answers). Everything else is secondary.
| Spec | What to ask | Why it matters |
| Dynamic range | 24–28 dB (FTTH drops) to 40–45 dB (PON through splitters, long-haul) | Each ~3 dB buys you one more splitter doubling or several more km |
| Dead zones | EDZ ≤ 1–3 m for FTTH patch panels and drops | Closely spaced connectors demand short dead zones |
| Wavelengths | 1310/1550 minimum; filtered 1625/1650 for live fiber | No filtered port = no safe live-PON testing |
| Sampling & resolution | 0.1 m-class sampling, ≥64k points | Determines how precisely faults are localized |
| Intelligent analysis | Auto multi-pulse, event map / iOLM-style view | Cuts training time and misreads—huge for junior techs |
| Field practicality | Battery ≥ 8–12 h, weight < 1 kg, .sor export | A spec sheet you can’t carry or archive is useless |
Price bands from the current market: capable entry handhelds run $150–300 (24–28 dB), mid-range field units $500–1,500, and premium carrier-grade platforms (EXFO, VIAVI) $3,000–6,000+ with 37–45 dB and advanced link mapping. The gap between bands is mostly dynamic range, live-fiber capability, and analysis software—not basic trace quality.
Specs tell you what the instrument can do; four test parameters decide whether it actually does it on your link. Set them wrong and even a 45 dB OTDR produces garbage:
| Parameter | What it controls | Field rule of thumb |
| Pulse width | Dead zone vs. reach (narrower = sharper events, shorter reach) | Short premises: 5–30 ns; metro/PON: 100 ns–1 µs; long-haul: up to 20 µs |
| Range | The fiber length window the OTDR samples | Set to ~1.5–2× the expected link length—too long adds noise, too short hides the end |
| IOR (index of refraction) | Distance accuracy for every event | Get it from the fiber datasheet; a wrong IOR shifts all distances systematically |
| Averaging time | Signal-to-noise ratio of the trace | 30–90 s typical; go 180 s+ on high-loss or through-splitter spans |
How Do You Choose the Right OTDR for Your Job?
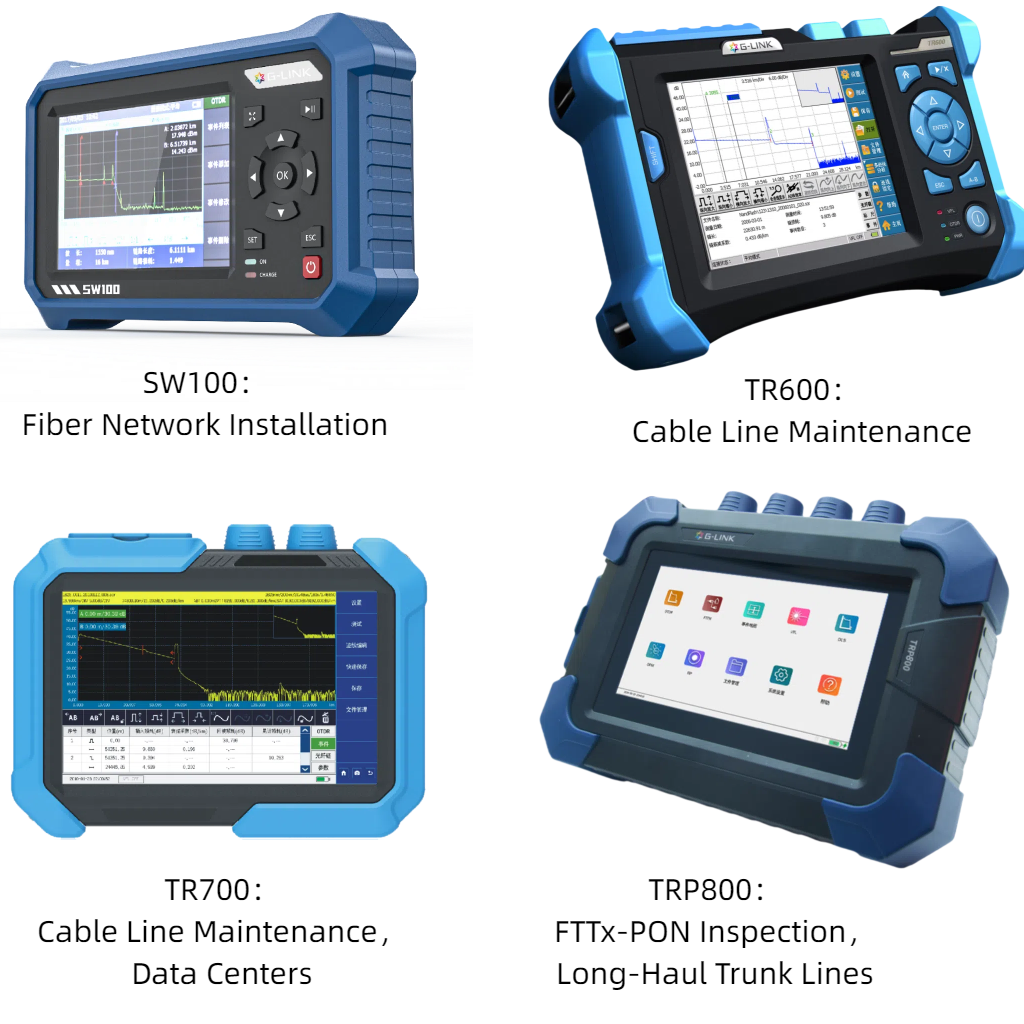
Work backwards from the network, not the spec sheet:
| Your work | What you need | Where to look |
| FTTH installation & drops | Short dead zone, 1310/1550, one-person operation, all-in-one tools | SW100 7-in-1 mini OTDR — OTDR + OPM + VFL + light source + RJ45 in one handheld |
| FTTx / metro certification | Tier 1 + Tier 2 workflows, bidirectional, .sor reporting | TR600 certification OTDR |
| Live PON troubleshooting | Filtered 1625nm port, 40–45 dB, multi-pulse FTTH mode | TRP800 PON OTDR — tested through 1:64/1:128 splits |
| Long-haul / backbone | 45 dB+ dynamic range, high sampling | TR700 series or TR600 |
| 24/7 unattended surveillance | Rack-mount OTDR test unit + optical switch, no dispatch | Continuous fiber monitoring — a different architecture, not a handheld |
One form-factor note before the table misleads anyone: handheld OTDRs dominate field work because faults are found by dispatch, but if your real requirement is “know the instant a fiber degrades, without sending anyone,” that’s the rack-mount / remote-test-unit category—permanently spliced into the network and testing on a schedule. It’s the same physics pointed at a different problem.
Three questions expose the wrong instrument fast: Can it test my live PON without disconnecting customers? Can it see through my worst-case split ratio? Can my least-experienced tech get a correct answer from it in one visit? If any answer is no, keep looking.
Not sure which fits your routes? Send us your link lengths, split ratios, and fiber types—our engineers spec test setups daily: contact our engineering team.
FAQ
What is a good splice loss on an OTDR?
A good fusion splice on single-mode fiber measures ≤ 0.1 dB. Anything above 0.3 dB warrants investigation—re-splice or inspect for contamination and core misalignment. Always confirm the value bidirectionally and average the two readings.
Why does my OTDR show different loss values from each end of the fiber?
Different backscatter coefficients in the fibers on either side of a joint distort the single-direction reading—this is normal, and it’s why standards require bidirectional testing. The true event loss is the average of both directions.
What is a “gainer” on an OTDR trace?
An apparent gain at a splice—a step upward instead of down. It’s an optical illusion caused by backscatter mismatch between the two fibers, not actual amplification. Verify from the other end; the averaged value will show the real (small) loss.
Do I need a launch cable for every OTDR test?
Yes—if you need to measure the first connector or splice. Without a launch cable, the dead zone after the OTDR’s own connector reflection blinds you to the first meters of the link. A 500 m single-mode launch cable covers most FTTH work.
Can OTDR testing interrupt live customer traffic?
Testing at in-band wavelengths (1310/1490/1550nm) on a live fiber absolutely can. Testing with a filtered 1625nm or 1650nm port cannot—those wavelengths sit outside the traffic bands, which is why live-PON OTDRs are built around them.
What file format should OTDR results be saved in?
The .sor format (Telcordia GR-196 / SR-4731). It’s the industry standard for trace storage, analysis, and handover documentation—any serious analysis software reads it.
What is bidirectional OTDR testing, and when is it required?
Bidirectional testing means measuring the same link from both ends and averaging each event’s two loss readings. It’s required by most certification standards and warranty programs because backscatter mismatch between fiber segments distorts any single-direction splice reading—a 0.05 dB splice can read as 0.4 dB (or as a “gainer”) from one side. Only the averaged value is contractually defensible.
What OTDR spec matters most for PON testing?
Dynamic range, by a wide margin. Your budget must cover the splitter loss (~15 dB for 1:32, ~21 dB for 1:64) plus fiber attenuation plus a 3–5 dB measurement margin—which is why live-PON work demands 40–45 dB-class instruments. A close second is a filtered 1625/1650nm port; without it, you cannot test in-service fibers at all.
Stop hunting for faults the slow way. G-Link builds the full OTDR testing lineup—SW100 for FTTH installers, TR600 for certification teams, and TRP800 for live-PON specialists—backed by 50 years of optical R&D at the CETC 34th Research Institute and ISO 9001/14001/45001 certified manufacturing.